Saturday
Nov122011

Apnoeas, me? My Baseline AHI

I'm going to be exploring some of the sensible and not so sensible suggestions in order to bring down my AHI (see my post "What is an Apnoea?" for an explanation).

To do that I needed reliable data, so I decided on a 5 day mean with a few basic rules:

  • No coffee after 3pm
  • Monday - Friday monitoring only (to ensure routine sleep and wake times)
  • No alcohol
  • No other supplements known to affect sleep
  • Begin sleep on my back (supine)
  • Motion detection IR camera (for verification of events if needed)
  • The same apnoea / hypopnea scoring criteria will be used throughout

I could use the IR camera to detect sleep position, but that would take a lot more time, so until I have a system that can detect that reliably then I won't include that data, and I may re-evaluate some weeks using that ability.

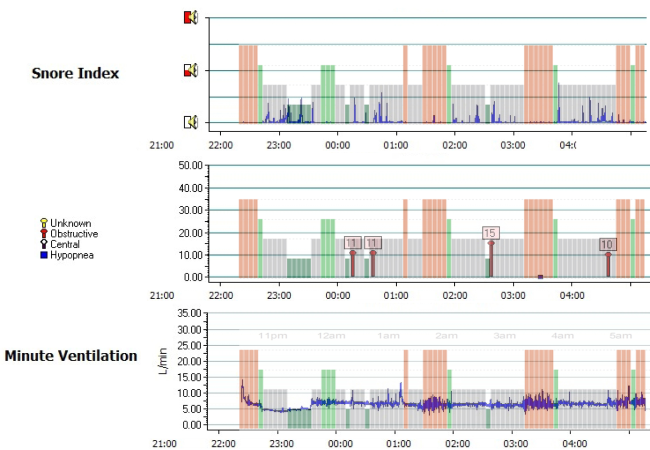
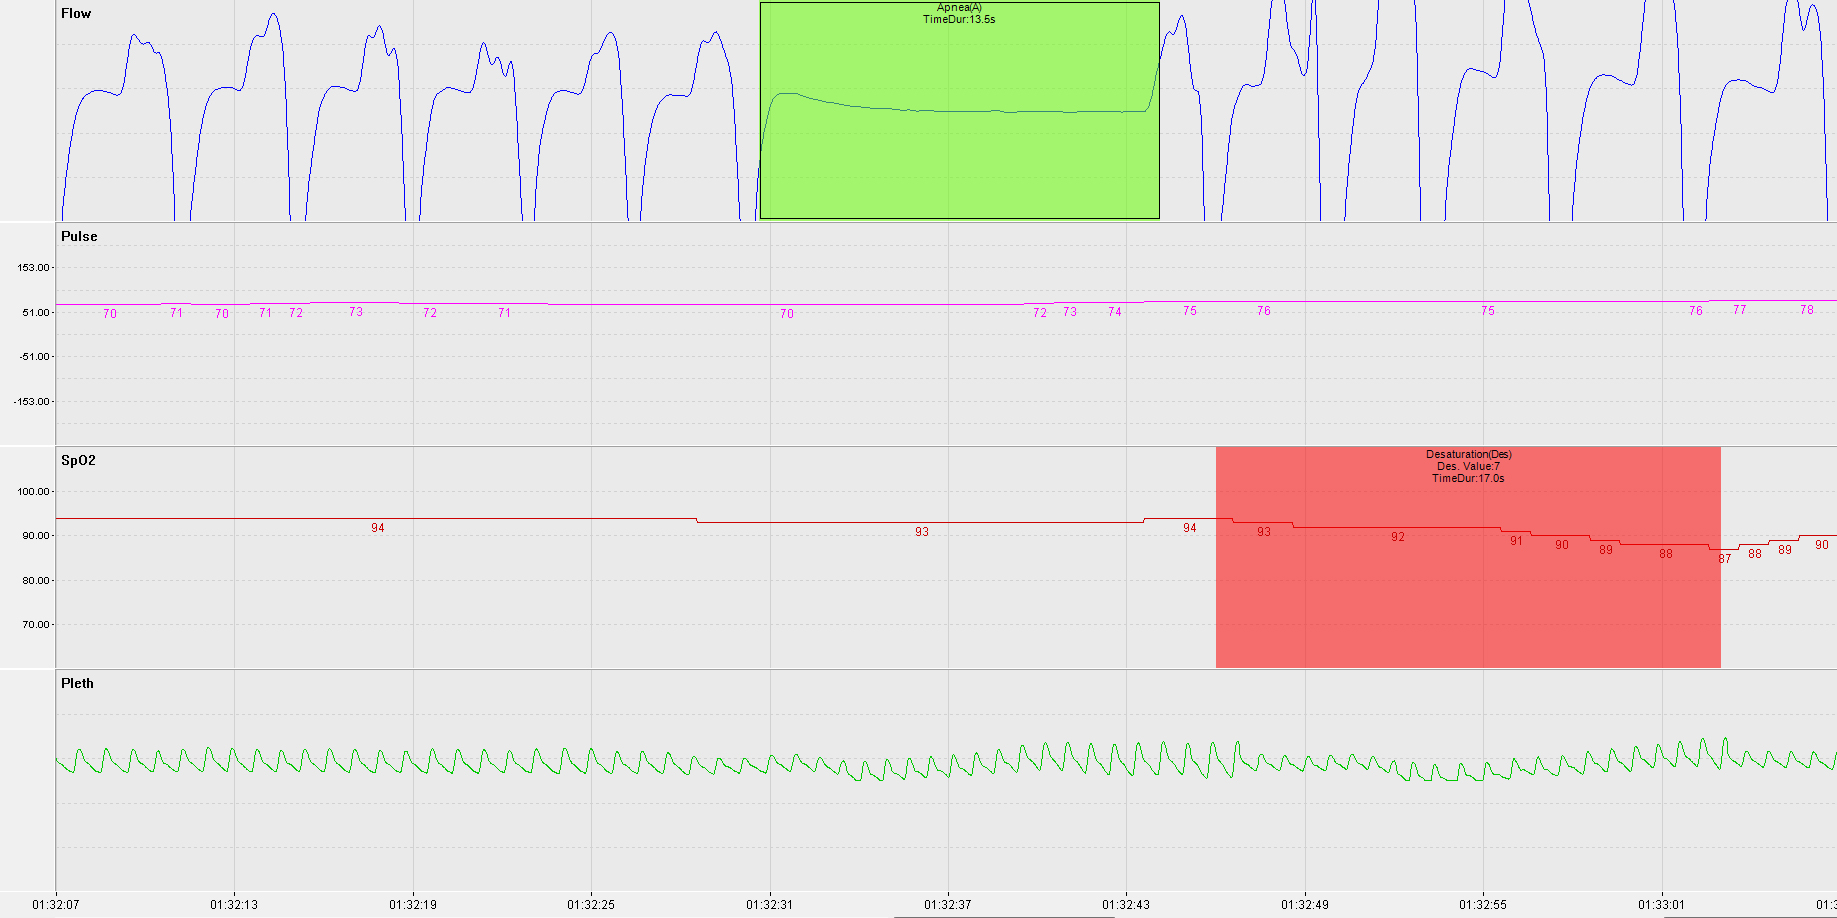
I did initially check the camera to see if I attempted to breathe when the system was detecting apnoeas. I did make some respiratory effort, so I will make the presumption (for now) that my apnoeas are obstructive in nature.

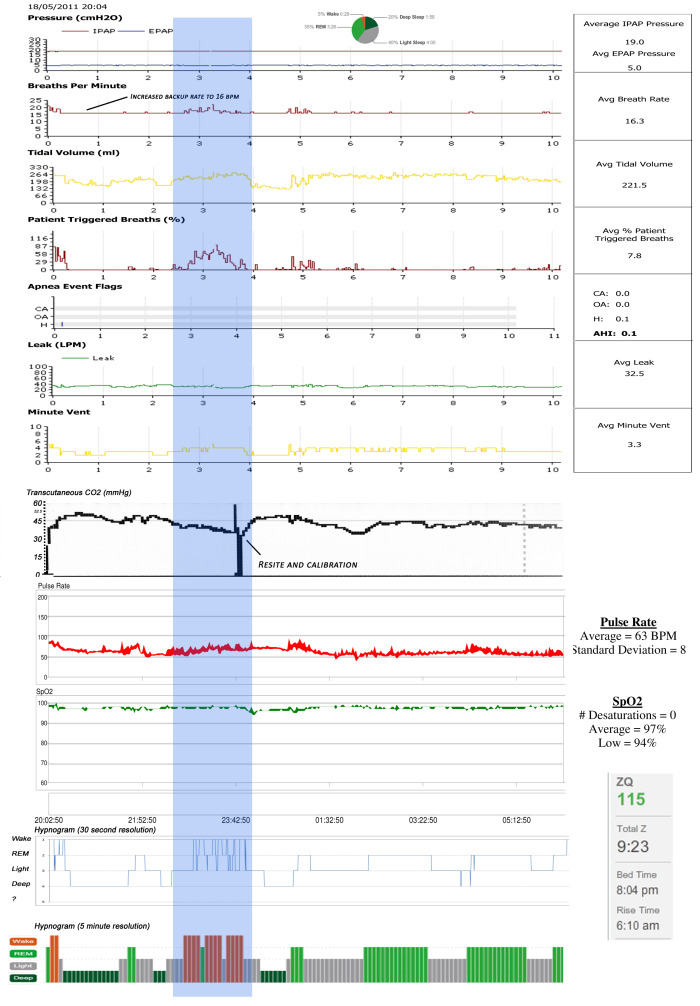
I also noticed that when the oxygen desaturations due to apnoeas were compared to the Zeo hypnogram, that like my son's, they were clustered around REM sleep.  

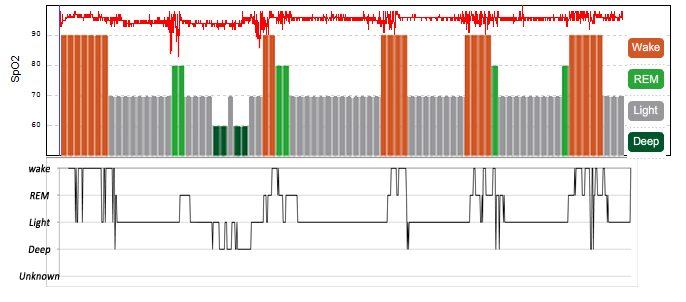
The top line is my oxygen level.

It does look like I'm awake for those periods, but the black line is a more detailed Zeo hypnogram (data calculated on a 30 second basis). Zeo has a scoring system and shows the highest scoring sleep stage as being the dominant one. "Wake" scores the highest; this makes sense, as being awake is probably the most important thing to show when you are supposed to be sleeping.

The 30 second graph shows why the main Zeo graph shows a lot of wakefulness during the night... I have oxygen desaturations which in turn wake me up, hence Zeo shows "wakefulness for the whole 5 minute epoch. However, when you see Zeo's calculations of time spent in each sleep stage, these are based on the more detailed 30 second data.

Sleep apnoea can run in families. Whether that is a factor or not, my diagnosis (albeit a self-diagnosis) doesn't surprise me. I sometimes snore, I wake up with headache a lot, and I could do with losing a bit of weight.

I have long suffered with sleep paralysis, and I suspect that being disturbed in REM sleep is a major factor in that, if not the sole cause.

So, how is this a problem?

My average AHI (number of apnoeas and hypopneas per hour) is 7, hence I am classified as having "Mild Obstructive Sleep Apnoea".

The classification ranges are:  

<5      -    Normal (unless symptomatic)
5-15   -    Mild
15-30 -    Moderate 
30+    -    Severe 

The REM element brings the name to "Mild REM-Related Obstructive Sleep Apnoea"

I will say that this "diagnosis" is an amateur one, it may not correlate with a professional one in a sleep lab, but if I use the same equipment throughout this experiment the results will still be valid, just relative to my original numbers.

So, what if I don't want to have that diagnosis, what if I want to be "normal" (says the man who sleeps with electrodes on his head, prongs up his nose and a camera watching him)?

Standard advice:

  • Lose weight if you are overweight (even a small amount can make a difference)

That's all very well, and something that I will do, but that won't help me fix my sleep tonight will it?

Other advice includes:

  • Prop the head of your bed up by 4-6 of inches (takes the weight off your neck)
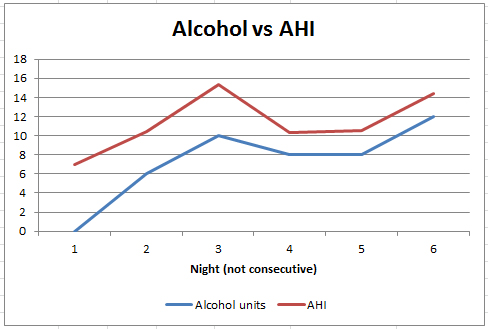
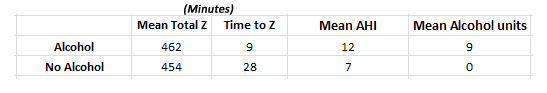
  • Cut down on alcohol (see this blog entry on alcohol)
  • Quit smoking
  • Use a mandibular advancement device (pushes the bottom jaw forward to hold the airway open)
  • Use a CPAP device (see this blog entry on NIV)
  • Avoid caffeine and heavy meals within two hours of bed
  • Use a nasal dilator (keeps the nostrils open)
  • Try a nasal saline spray
  • Throat exercises
  • Surgery

I'll evaluate some of these (plus a few more ideas that I have) and back up the findings with a 5 day mean AHI and sleep graphs.

Let's face it, we're all looking for quick-fix solutions, and I'm not trying to cut corners, but I am trying to help myself whilst on the journey to losing a bit of weight.

So that I don't confuse the issue I will not intentionally lose weight until I have tried some of the other methods.

So, in essence I am looking for some way of bringing my AHI down, along with the time that I spend awake at night.

...but before I do that, how about trying to INCREASE my AHI? Next blog post.


Saturday
Nov122011

A nightcap - Alcohol and Apnoeas


A nightcap helps you sleep, right?

Well, yes but...

During my initial explorations with the flow-meter, I thought that I'd test my set-up by trying to INCREASE my AHI using a well known substance that makes sleep apnoea worse...

Alcohol.

A sleep experiment where I get to have a drink or three... it's tough, but I'll do it for science. 

Pretty much as it does with people, alcohol relaxes the muscles in the airways making them more prone to flopping around all over the place and causing an obstruction.


When it comes to the rest of the practices, gadgets, fads and ideas that I'll be exploring I'll be testing them for 5 days in a row each. To be honest I'm not going to do that with alcohol as I can't afford a week of waking up sluggish and groggy. 

So, what I did was to take 5 non-consecutive days instead. I consumed alcohol and recorded my AHI on those nights along with my 5 day no-alcohol mean AHI for comparison (see previous blog).


Pretty conclusive.

Alcohol increased the number of times that I either stopped breathing or breathed so little that it was ineffective.  

Not only that, but it did it in quite a startling way. It took my 5 day mean AHI from 6.95 to 12.2.(max 15.3) To get that into perspective, that's nearly double the number of times PER HOUR that I had breathing problems.

As discussed on the post "My Baseline AHI", I went from just scraping in with a diagnosis of "Mild Obstructive Sleep Apnoea" to being firmly in the category!


Surely there was something positive to salvage from this bad news?

Yes. Annecdotally, in my mind alcohol helped me to get to sleep and I found that the Zeo data backed that up. Again, using a 5 day mean value, my time to sleep onset (or Zeo's "Time to Z") went from 28 minutes without alcohol down to 9 with alcohol.

That seemed to be the only significant difference in the data, so I haven't bothered to clutter the page with other measurements.

It may help you to get to sleep, but the chances are that the sleep will not be good sleep. The chances are that it will be disturbed sleep, the chances of having to go to the bathroom will increase, as will the likelihood of dehydration-related headaches and fragmented sleep towards the morning.

Not only would I wake up feeling slow and mildly hungover, but I'd be tired from being woken up up to 15 times an hour through apnoeas.

Don't misunderstand me, this isn't one of those damning posts about alcohol, but it is something to bear in mind if you already suffer with sleep apnoea, and it may even cause mild apnoea in people who don't have it.

Will I continue to drink alcohol? Of course, and that's the dilemma. So I guess the answer is "everything in moderation".


Thursday
Nov102011

Zeo & CPAP / BiPAP

I've posted on a couple of CPAP boards (and read at more) and it's clear that there are a lot of us who like to see what the ventilators are doing overnight and how many apnoeas & hypopneas there are. Quite a few of us own pulse-oximeters too, so this data can also be included.

One problem is that each device has it's own printout making comparing them tricky.

I created an A4 page in Photoshop and found that it was then easy to align all the graphs as long as all the monitors were were started and stopped at the same time (or as close as you can manage).

You can either print all the various outputs to PDF files using either Adobe or the free CutePDF then open them in Photoshop or you can take a screenshot from each piece of software.

Then cut and paste each graph onto your A4 blank and stretch them so that the start and stop times align.

Below is an example of one from a night of my son's BiPAP data. 

It includes: 

  • BiPAP output (Pressure, RR, flow rate, triggered breaths, apnoeas etc)
  • Transcutaneous CO2 (actually a reprocessed photo of the onboard graph)
  • Oximetry trend
  • Pulse rate
  • Zeo 30 second resolution hypnogram
  • Zeo 5 minute resolution hypnogram


I then pasted bits of relevant data from Zeo and the oximeter around the edge.

This is from a night of making adjustments to the backup rate of breaths and is a good example of what aligning the data can reveal.

Take a look at the highlighted strip and work down from the top...

  • The backup rate had been increased a couple of hours before. 
  • Then in the highlighted part you can see that the number of breaths increased even more.
  • However, there was a much higher increase in the number of breaths he was doing for himself

Why?

When you look down to the Zeo hypnogram it becomes clear. The extra breaths were waking him from sleep, hence his spontaneous respiratory rate increased even more.

The backup rate was too high, so I reduced it.


I have also tried the Zeo with CPAP on myself.

Here is a simple overlay of the Zeo hypnogram onto the ResScan report. (I pasted the hypnogram into a new layer in Photoshop and then made it semi transparent).

A correlation between minute ventilation and periods of being awake (actually broken REM according to the 30 second hypnogram) is easy to see.

Also the apnoea flags point to me losing deep sleep due to apnoeas.

More about that and what I plan to do about it in another post though.

Sunday
Nov062011

Zeo Sleep Monitor

In many blog-posts I'm going to be talking about some devices that I use to monitor my sleep. So I thought it best to explain a bit about them. The first one is the Zeo.

There are two flavours of Zeo, a bedside unit and a new mobile version that pairs with your smartphone.


 Both devices consist of a wireless headband containing fabric electrodes which are used to measure your brainwaves using EEG technology. Previously EEGs were confined to sleep laboratories and hospitals. They involved gluing electrodes onto your scalp and connecting them to a computer in order to detect the voltage changes that take place in your brain. Interpreting these EEGs is a skill in itself.

During a full polysomnography sleep study, a sleep technician will manually look at each 30 second chunk of data (epoch) from the EEG (then combine it with data from what your eyes were doing and how tense your muscles were) in order to determine which stage of sleep you are in. Zeo is much neater and doesn't involve glue or wires.

A typical night with Zeo goes something like this:

  • When you are ready to sleep, remove the headband from it's magnetic dock/charger
  • Place the headband on your head with the block roughly central on your forehead
  • Wait for the little symbol of a head to illuminate (that means it has detected a brainwave pattern - always a relief)
  • Sleep
  • Wake, remove and re-dock headband

Both versions allow you to instantly see how you slept last night but you can also upload and view the data via the Zeo website. The site allows greater analysis of how you slept; you can also complete a sleep journal detailing coffee and alcohol intake, your "morning feel" and various other factors to help you see a cause-and-effect relationship between them and how you sleep.

A device that reads your brainwaves... you know you want one. This is where you can get them from in the UK: http://myzeo.co.uk/

So, what does the Zeo actually measure?

As previously said, it uses an EEG, combined with an EOG (eye movements) and EMG (muscle tone) to determine which state of sleep you are in. It then presents this to you in a colourful graph called a hypnogram.

Whereas a sleep technician looks at every 30 seconds, Zeo examines every second of data and makes a decision, it then amalgamates these into 30 second chunks using a proprietary scoring system.

The makers of Zeo have released a special firmware for the bedside unit that allows you to plug a computer into the port on the back and see the actual EEG and play it back in the morning. You can see all the little blips and squiggles and how they relate to your sleep.

 This, for example, is a "Sleep Spindle" it signifies that I was in stage 2 sleep...

Sleep consists of cycles of deep, light, wake and REM (Rapid Eye Movement). On a formal hypnogram you may see these listed as an N and a number. The N simply means Non-REM. N1 and N2 are considered to be light sleep. N3 (and sometimes N4) are considered to be deep sleep.

Early in the night is when you get the most deep sleep, which then decreases through the night and is "replaced" with increasing amounts of REM

 Hence, a normal hypnogram (sleep stage graph) should look something like this:

Graph taken from "A good night's sleep part one: Normal Sleep" by Dr Sue Wilson.
"Nursing & Residential Care", November 2008

Zeo's hypnograms display data at resolution of 5 minutes. The 30 second resolution graph is available by exporting the data into a spreadsheet program.

This is one of my recent hypnograms from Zeo, and as you can see it's a mess...

That's where the Zeo's journal comes in... WHY is it a mess? Too much coffee in the afternoon? Too much wine in the evening? Is the room too warm? Do I always wake up at the same time in the night? Why is that? Could it be the heating making noises? etc etc.

By looking at the patterns, you can aim to work out why your night is disrupted (if it is). If you are one of the lucky ones who seem to sleep normally then you can aim to improve on that sleep to make sure you feel bright and energetic in the mornings.

What's wrong with my graph?

Looking at the the night shown above, there are a couple of things that jump out:

  • Deep sleep - not enough of it, and doesn't follow the pattern of decreasing through the night. This is clear because my body obviously tried to catch-up on deep sleep at 7:30am!
  • I have WASO (Wake after sleep onset), but it seems that they are not random, they seem to be clustered around what should be solid chunks of REM. 

These REM disturbances are what I believe leads to episodes of sleep paralysis. I will do a blog post on that later, but there is a good article on Wikipedia about it here: http://en.wikipedia.org/wiki/Sleep_paralysis

So all in all, much to improve on.

I did suspect that I had REM related issues. Maybe a small part of my son's condition is hereditary? Maybe not, maybe it's just coincidence.

For the 10 years that it took to get my son's sleep and breathing under control I was forever listening out for his oxygen alarm. He would stop breathing during REM sleep and the alarm would sound to alert me to it.

I'd then wake up, glance at the alarm on the camera that I'd installed and then go in to rouse him from sleep and get him to breathe again.

This would happen many times a night. Children have a lot of REM! 

Maybe in some way my brain had adapted to not be quite asleep, forever on the lookout for my son's alarm that everyone else in the house slept through (including him)!

My son's breathing is now regulated by BiPAP (A breathing machine that delivers alternating pressures of air via a mask - more about that in another post). That started about 6 months ago, so I thought I would have settled down into a decent sleep routine now. 

I decided to explore and used some of the cameras and monitors that I had used for my son on myself. After a couple of nights I now have a fair idea of why I wake in REM. So, I've decided to be a bit more disciplined about collecting data and recording what I'm up to.

This week I'll be gathering data for 5 nights (Mon - Fri) and will post the data and its mean as a baseline for my sleep, then I am going to try a different method of "fixing it" every 5 nights (Mon - Fri) and average for consistency.

I'll blog the results as I'm going along.

Next post: baseline sleep scores. 


Wednesday
Nov022011

What is an "Apnoea"?

If you search for "Apnoea" on Google, you will probably be given results for "Apnea" - it's the same thing but with an American spelling.

Quite simply, an apnoea is a pause in breathing.

There are different types and causes of apnoea, and in the last 10 years one type: "Obstructive Sleep Apnoea " has taken centre-stage. According to a recent tweet by @RespironicsUK it has gone from being not really recognised to a "huge epidemic".

Obstructive Sleep Apnoea occurs when the muscles of the throat relax in sleep, effectively closing the airway off and preventing breathing. This is despite the breathing muscles of the chest and diaphragm still moving. It's akin to trying to breathe with your mouth closed whilst someone is pinching your nose.

This is a graph of an apnoea. The blue line is the airflow (breaths). The highlighted portion shows anpnoea.

The purple line is the heartrate. The red is the oxygen levels.

The oxygen doesn't drop instantly (after all, we can hold our breaths for a fair while before we gasp for air), but when it does drop it drops rapidly past a certain point due to the oxygen desaturation curve (the graph looks a little like a slide in that you can shuffle along the top descending slowly but when you reach the tipping point you shoot down fast).

So, the blood oxygen levels fall (while the CO2 levels rise - not graphed). This causes the brain to briefly wake the sleeper so that they breathe normally. Sometimes they wake up with a snort, or a choking feeling.

So, they wake up and problem solved?

Not really.

Waking up deals with the immediate issue of low oxygen and high CO2, but this can happen hundreds of times a night, often without the sleeper realising it. In the morning they wake feeling groggy and tired because they have been deprived of sleep.

During sleep monitoring the number of apnoeas and hypopneas is recorded and converted into an hourly rate known as the AHI - Apnoea Hypopnea Index. 

A low AHI (under 5) is considered acceptable unless the sleeper is experiencing problems. but with a high AHI the sufferer isn't just "a bit tired" they are sleep-deprived and have to deal with the effects of that:

  • making mistakes 
  • napping
  • falling asleep at inappropriate times
  • depression
  • heart problems
  • stroke
  • headaches
  • weight gain

Obstructive sleep apnoea can be made worse by alcohol (it relaxes the throat muscles more) and by being overweight (because the increased mass around the neck adds to the burden). By losing weight and reducing alcohol consumption it is (in some cases) possible to eliminate the problem.

There are treatments available ranging from lifestyle changes to surgery. A common solution is a CPAP machine that keeps your airways open during sleep by maintaining a constant pressure of air in your airways via a face mask. 

Treatments  will be the subject of a later post. For now I just wanted to make a start.


Page 1 ... 3 4 5 6 7