Zeo & CPAP / BiPAP
 Hypnagogia Blog
I've posted on a couple of CPAP boards (and read at more) and it's clear that there are a lot of us who like to see what the ventilators are doing overnight and how many apnoeas & hypopneas there are. Quite a few of us own pulse-oximeters too, so this data can also be included.
One problem is that each device has it's own printout making comparing them tricky.
I created an A4 page in Photoshop and found that it was then easy to align all the graphs as long as all the monitors were were started and stopped at the same time (or as close as you can manage).
You can either print all the various outputs to PDF files using either Adobe or the free CutePDF then open them in Photoshop or you can take a screenshot from each piece of software.
Then cut and paste each graph onto your A4 blank and stretch them so that the start and stop times align.
Below is an example of one from a night of my son's BiPAP data.
It includes:
- BiPAP output (Pressure, RR, flow rate, triggered breaths, apnoeas etc)
- Transcutaneous CO2 (actually a reprocessed photo of the onboard graph)
- Oximetry trend
- Pulse rate
- Zeo 30 second resolution hypnogram
- Zeo 5 minute resolution hypnogram
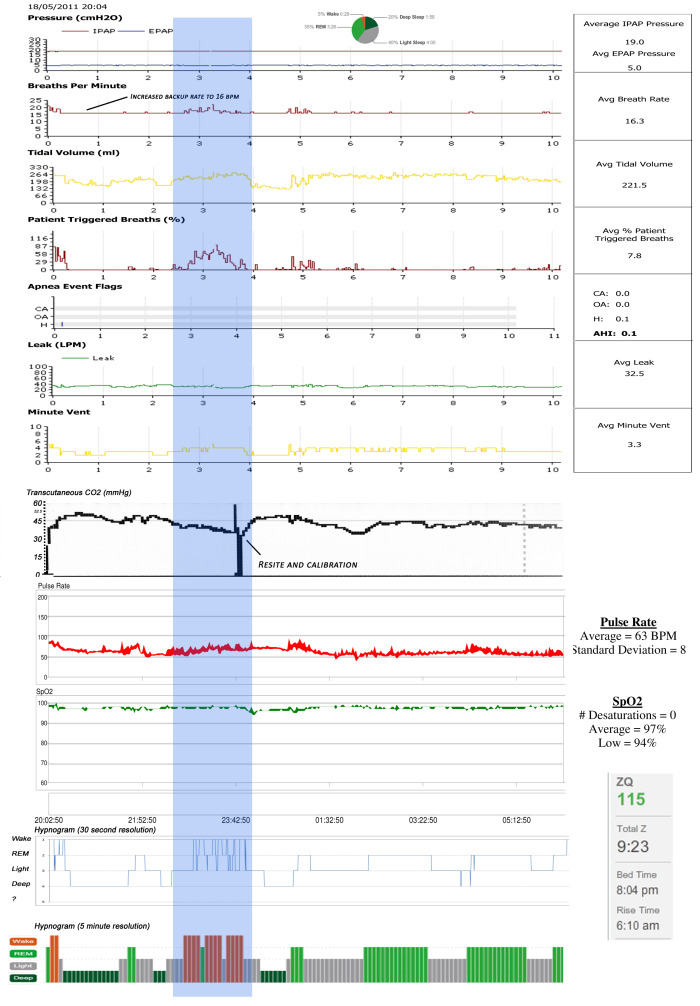
I then pasted bits of relevant data from Zeo and the oximeter around the edge.
This is from a night of making adjustments to the backup rate of breaths and is a good example of what aligning the data can reveal.
Take a look at the highlighted strip and work down from the top...
- The backup rate had been increased a couple of hours before.
- Then in the highlighted part you can see that the number of breaths increased even more.
- However, there was a much higher increase in the number of breaths he was doing for himself
Why?
When you look down to the Zeo hypnogram it becomes clear. The extra breaths were waking him from sleep, hence his spontaneous respiratory rate increased even more.
The backup rate was too high, so I reduced it.
I have also tried the Zeo with CPAP on myself.
Here is a simple overlay of the Zeo hypnogram onto the ResScan report. (I pasted the hypnogram into a new layer in Photoshop and then made it semi transparent).
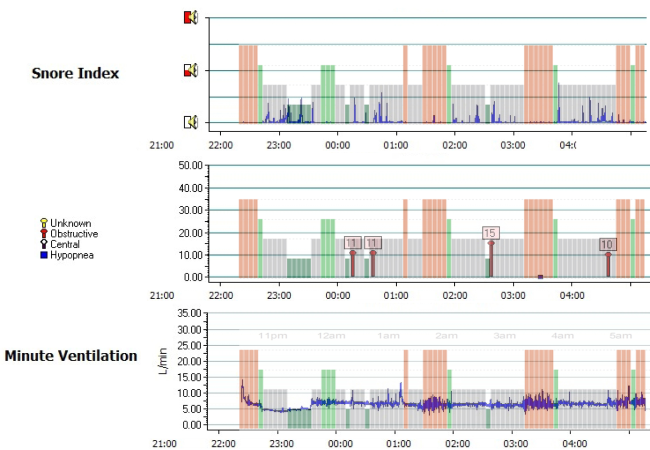
A correlation between minute ventilation and periods of being awake (actually broken REM according to the 30 second hypnogram) is easy to see.
Also the apnoea flags point to me losing deep sleep due to apnoeas.
More about that and what I plan to do about it in another post though.