Zeo & CPAP / BiPAP
 Hypnagogia Blog
I've posted on a couple of CPAP boards (and read at more) and it's clear that there are a lot of us who like to see what the ventilators are doing overnight and how many apnoeas & hypopneas there are. Quite a few of us own pulse-oximeters too, so this data can also be included.
One problem is that each device has it's own printout making comparing them tricky.
I created an A4 page in Photoshop and found that it was then easy to align all the graphs as long as all the monitors were were started and stopped at the same time (or as close as you can manage).
You can either print all the various outputs to PDF files using either Adobe or the free CutePDF then open them in Photoshop or you can take a screenshot from each piece of software.
Then cut and paste each graph onto your A4 blank and stretch them so that the start and stop times align.
Below is an example of one from a night of my son's BiPAP data.
It includes:
- BiPAP output (Pressure, RR, flow rate, triggered breaths, apnoeas etc)
- Transcutaneous CO2 (actually a reprocessed photo of the onboard graph)
- Oximetry trend
- Pulse rate
- Zeo 30 second resolution hypnogram
- Zeo 5 minute resolution hypnogram
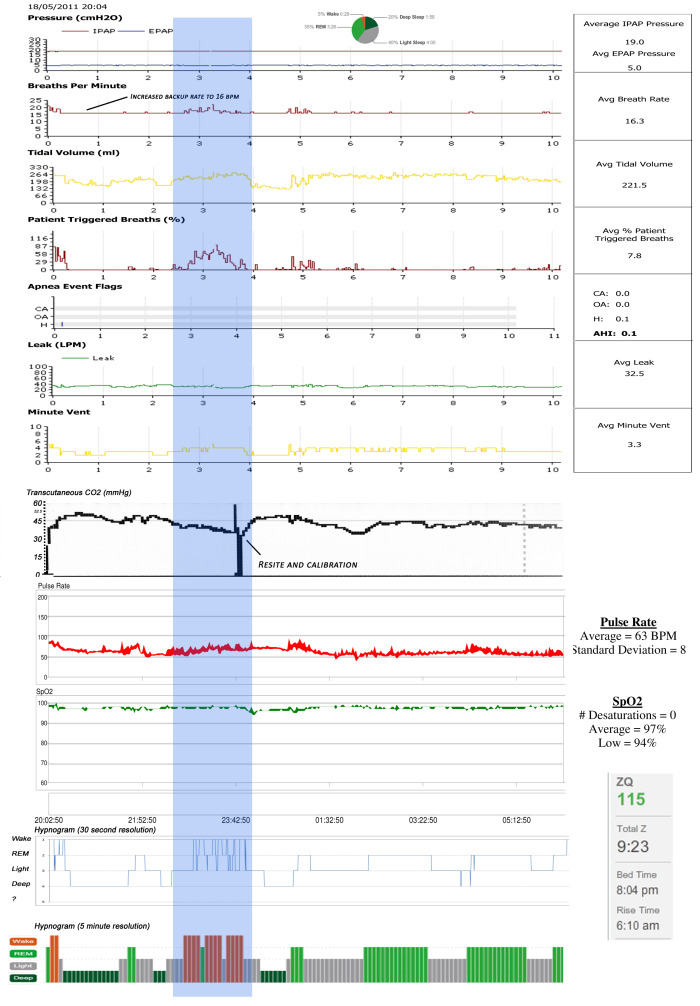
I then pasted bits of relevant data from Zeo and the oximeter around the edge.
This is from a night of making adjustments to the backup rate of breaths and is a good example of what aligning the data can reveal.
Take a look at the highlighted strip and work down from the top...
- The backup rate had been increased a couple of hours before.
- Then in the highlighted part you can see that the number of breaths increased even more.
- However, there was a much higher increase in the number of breaths he was doing for himself
Why?
When you look down to the Zeo hypnogram it becomes clear. The extra breaths were waking him from sleep, hence his spontaneous respiratory rate increased even more.
The backup rate was too high, so I reduced it.
I have also tried the Zeo with CPAP on myself.
Here is a simple overlay of the Zeo hypnogram onto the ResScan report. (I pasted the hypnogram into a new layer in Photoshop and then made it semi transparent).
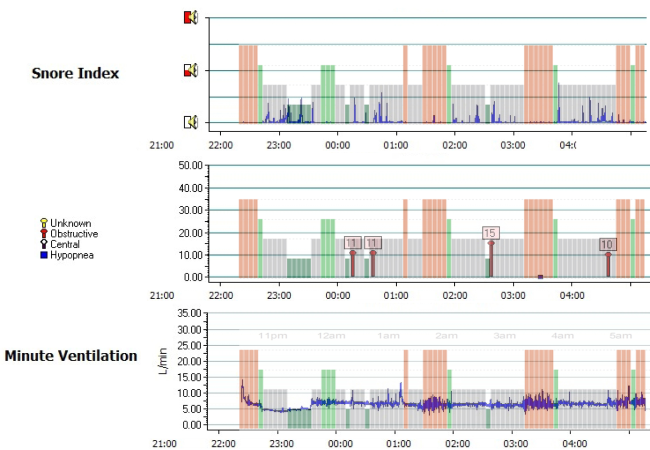
A correlation between minute ventilation and periods of being awake (actually broken REM according to the 30 second hypnogram) is easy to see.
Also the apnoea flags point to me losing deep sleep due to apnoeas.
More about that and what I plan to do about it in another post though.
Reader Comments (5)
Great work, fascinating reads, really cool how you photoshop those overlays. How we wished for the CPAP manufacturers to come up with an open data platform, with a single set of open source software to rule them all... But no, like you we have to use disparate packages and try and piece it all together. You're doing a wonderful job at that! Great to see how Zeo can really add insight. People never realise how broken their sleep is because of apnoea. All they remember is 8 hours sleep. But with the Zeo data you can see it was rubbish sleep.
And what I really like... Is that someone in the UK is doing all this cool stuff. It's normally the US sleep geeks going all hardcore but we're really proud to have you around this side of the old Pond! I hope you will find plenty of time to put more stuff on. And if we can help with loaning some of the sleep study equipment we use on Sleep-Study.co.uk, just let us know. For example, the positional data would be fascinating to add.
Thanks for taking the effort to put these complex graphs up, it's really great, seeing the bigger picture.
Hi James,
Thank you very much for your kind comments.
I think the Zeo really adds a lot to sleep monitoring. If only, as you say, other manufacturers used open source software, then there would be much potential for combining data.
Thank you also for the offer of a loan of equipment, I really appreciate that and would like to take you up on that offer at some stage. Positional data and even respiratory effort would be great elements to add to a study.
Thanks again.
Hypnogogia, I've done a little work like this myself. See my posts in the CPAPtalk.com forum here: http://www.cpaptalk.com/viewtopic.php?f=1&t=68747&st=0&sk=t&sd=a&hilit=build#p638020.
To synch the data, I created a template in OpenOffice draw with equally spaced vertical lines representing hours of time. I use the background grid for minutes of time. Then to synch, I place a snip of a data report over the lines and size it to fit the lines. This works well for instruments which have a clock and the reports are referenced to time of day. For instruments without a true time-of-day clock, artifacts can be created at known times and then the snips can be aligned on the template with other data.
Jay
Thanks for the link to your posts.
It's really good to see how others are using the data available and using as many resources as they can to help figure out what is going on in their sleep.
One interesting thing is the result that you've achieved with vitamin D3 and B12. I'm also doing something similar at the moment (well, for the last 2 weeks or so) and have seen similar results.
REM has gone from an average of 1:40h to 2:20h and my Deep sleep has increased by about 10 mins to 50m. Wake after sleep onset has dropped significantly too.
I plan to make a post about it as soon as I have enough data, as I'm trying some other supplements with the D3 and B vits.
I also suspect that, for me, being tired leads to being sedentary, which in-turn leads to lower deep sleep, which leads to being tired etc etc. I may just have to force myself to do some more excercise and see what happens to the amount of deep sleep I get.
There is a free open-source sleep data program called SleepyHead which can import data from most CPAP machines...and it can import data from the Zeo website.